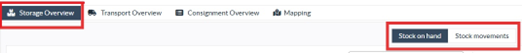
The storage overview gives a comprehensive view of the overall stock on hand and stock movement across different locations registered in RITA. Storage overview has two main components:
- Stock on hand
- Stock Movement
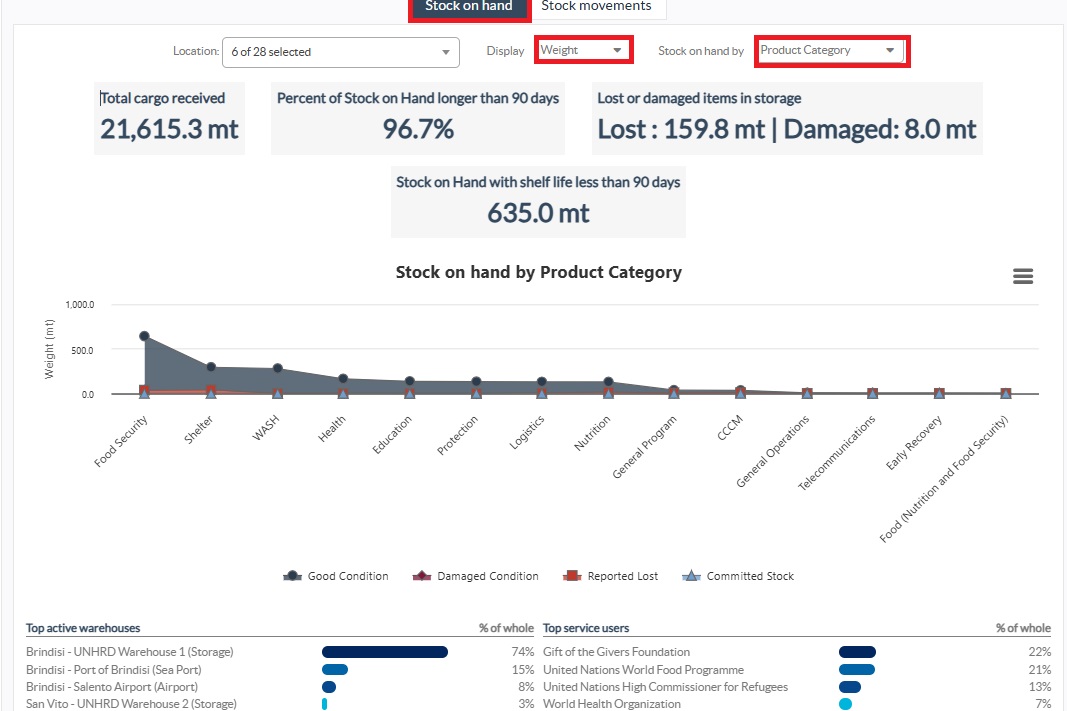
"Stock on hand" shows the inventory available at the storage facility, including the warehouse and transshipment point, on the specified date. The dashboard allows RITA operators to customize the view by selecting specific locations and appropriate grouping criteria based on individual needs.
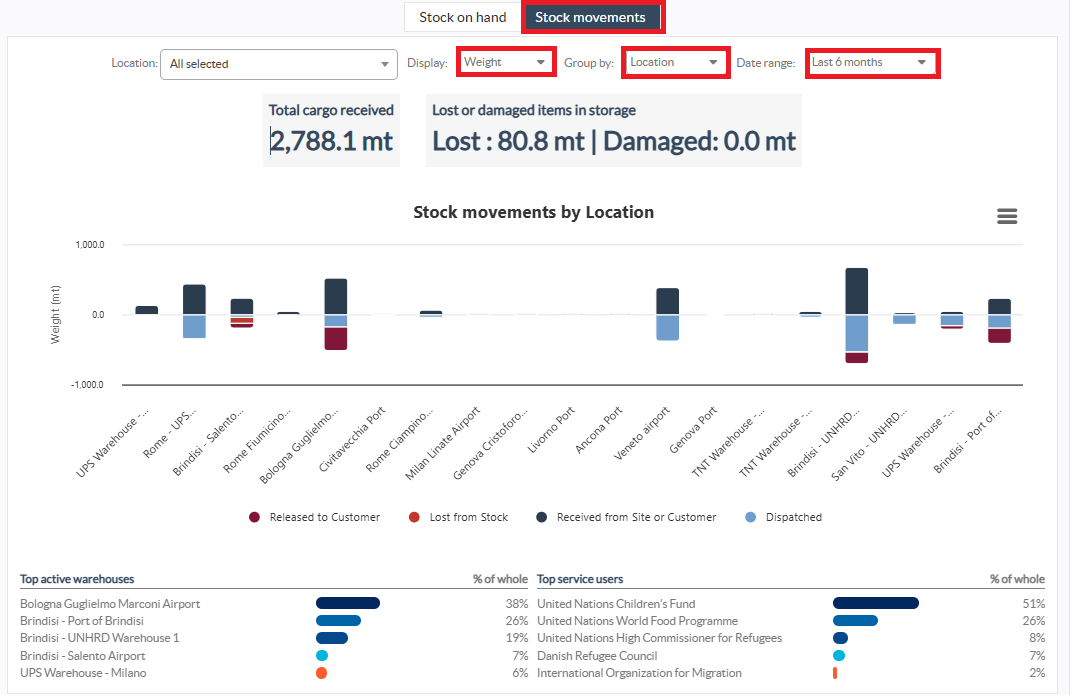
"Stock Movement" enables the RITA operator to get a graphical presentation of the overall stock movement, received, released, dispatched, and lost from the warehouse- filtered by location, product dimensions such as weight, volume, value, number of consignments, line items, and date:
Different criteria’s for filtering the data are listed below:
Location Filter: A dropdown menu with all the storage facilities registered in the project location group appears. By default, “Select All” shows data for all the locations.
Show Metric: RITA operators can use the “Show Metric” dropdown to display different metrics in the chart, outlined below. These metrics are listed on the X-Axis (Horizontal column) of the chart:
| Weight: | Displays the weight of the stock in MT. |
| Volume: | Displays the volume of the stock in M3 |
| Value: | Shows the value of the stock in USD. |
| Number of Consignments: | Displays the total number of consignment created, in progress or closed. |
| Number of dangerous consignment lines: | Highlights the number of consignment line items containing dangerous items. |
Group by: The “group by” dropdown allows RITA operators to group the data by different categories, highlighted below; these metrics are on the chart's Y-axis (vertical rows).
| Date: | Transaction date as needed in the chart, by the operation |
| Location: | Storage locations and transshipment point registered under the project. |
| Sub-Region: | Sub Region is a more specific area within the region such as city/district/county, in which the location belongs. |
| Region: | Region refers to larger geographical area such as state/ department where the location belongs |
| Service User: | Service users are organizations that have used the storage service. |
| Service user type: | Service user types are categories that an organization belongs to, such as UN, INGO, NGO, Government, commercial sector, etc. |
| Product Category: | Product category refers to the project for which the stored items are used, such as food security, health, shelter, education, logistics, etc. |
Stock Condition: The graph uses different colors to indicate the condition of the goods:
| Blue Color: | Good condition |
| Red Color: | Damaged condition |
| Orange Color: | Lost items |
| Light Blue Color: | Committed stock |
The Stock Movement The stock movement chart displays different stock activities: cargo released to the customer, cargo lost from stock, cargo received from the site or customer delivered by the customer, and cargo dispatched, each represented by distinct colors as indicated in the legend.
Example 1: The graph below illustrates the stock on hand in MT (good, damage, committed, and lost) in six selected locations of the project, grouped by product category:
Example 2: The graph below illustrates the stock movement by weight over the last six months (in MT). It shows items received, released, dispatched, and lost from stock, further grouped by all locations.
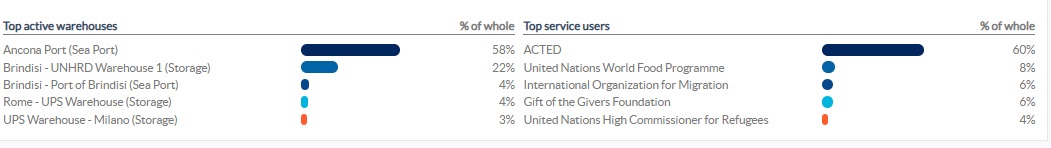
The operators can also see a summary of the top active warehouses (warehouses with the highest number of transactions) and top five service users (service users based on their percentage of total stock weight), along with their respective usage percentages within the specified period.