
"Service users" graph enable RITA operators to generate graphs per agency across all types of services.
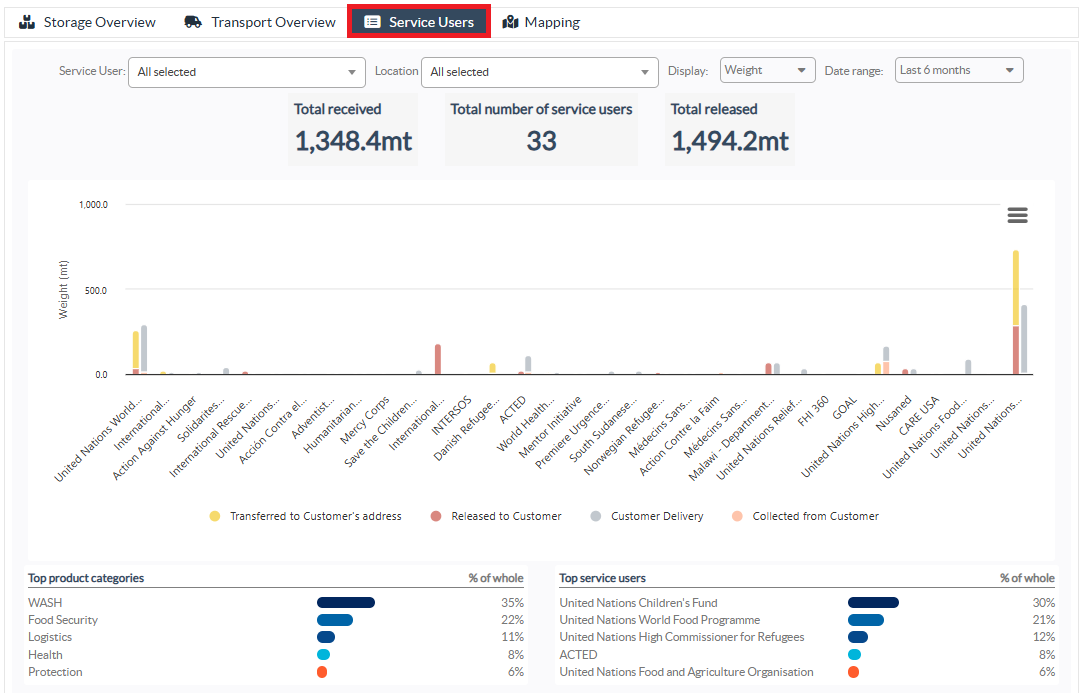
The chart displays different services: cargo transferred, cargo released to the customer address, cargo delivered by the customer, and cargo collected from the customer address, each represented by distinct colors as indicated in the legend.
Different criteria for filtering graphs are listed below:
Service User Filter: A dropdown menu displays all the service users registered in the project location group. By default, "All Selected" shows all the users.
Location Filter: A dropdown menu appears with all the locations, including storage facilities, customer addresses, and transshipment points registered in the project location group. By default, "Select All" displays data for all locations.
Display Filter: The display filter allows the RITA operator to choose between Weight and Volume. Selecting "Weight" shows the cargo weight in metric tons (MT), while selecting "Volume" displays the data in cubic meters (m³).
Date Range: This option enables the RITA operator to select the desired transaction date range.
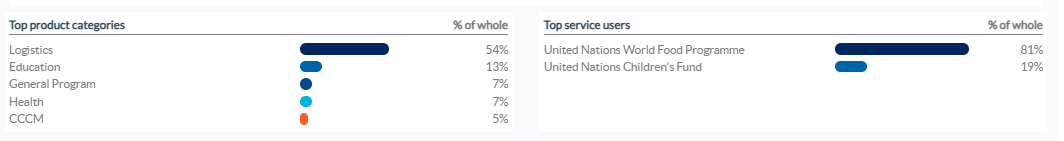
Operators can view a summary of the top five service users that have primarily utilized the Logistics Cluster services within the selected locations and date range - this summary is based on the weight or volume criteria chosen.
Operators can also see the top five product categories stored or transported by these service users through the cluster facility – this summary includes the respective usage percentages for each service user and product category within the specified period.
