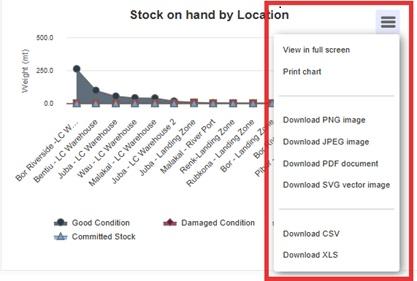
The Dashboard provides the operation an instant snapshot of performance to date. It is an interactive tool that enables RITA operators to choose from multiple variables (such as weight, volume, value, line item, and consignments), select date ranges, locations and transport routes. In some instances, it's possible to overlay data. RITA operators can export both data and static images.
Dashboard has four key components:
Printing and Downloading Options
| View in full screen: | The operator can expand the chart or graph in full screen for better visibility. |
| Print Chart: | The print option enables RITA operators to directly print the displayed graph/chart. |
| Download PNG Image: | RITA operators can download the graph/chart as a PNG file. PNG is a widely popular format known for its ability to maintain high image quality. It is ideal for use in presentations, documents, and for sharing digital images. |
| Download JPEG Image: | RITA operators can save the chart as a JPEG file. JPEG files are generally smaller in size and can be used for quicker sharing. |
| Download PDF document: | The operators can export the chart as a PDF file, making it easy for sharing and printing. |
| Download SVG vector Image: | Dashboard enables the operator to download the chart in an SVG file, a scalable vector format that enables infinite zoom without loss of quality, making it perfect for design and editing purposes. |
| Download CSV: | The operators can download the data behind the chart in CSV (Comma-Separated Values) format, which can be opened in spreadsheet programs like Excel etc. |
| Download XLS: | The operators can download the chart's data in XLS format, which is compatible with Microsoft Excel for further analysis. |


