Upload Temperature Logger File:
The Upload Temperature Logger feature allows operators to upload, manage, and monitor temperature data recorded within the storage. This function helps ensure that all temperature-controlled storage conditions are properly documented and compliant with operational standards. This functionality allows users to maintain complete visibility of temperature-controlled storage environments, ensuring that warehouse conditions meet the required quality and safety parameters.
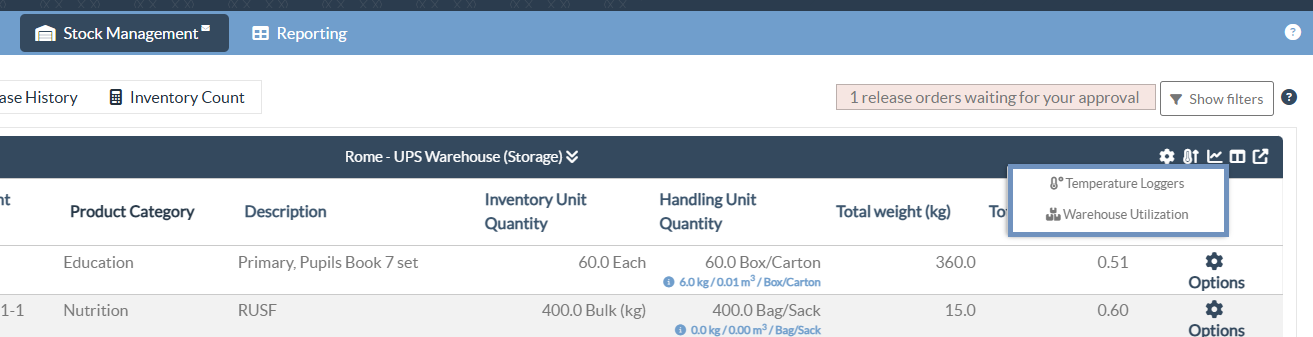
Step 1: Go to the "Stock Management" tab and select the storage location. Click on the Temperature Loggers icon on the top right corner of the screen.
Step 2: In the Upload Temperature Logger File window, enter the Equipment Name and provide any relevant Remarks. You can either click “Choose File” or drag and drop the file directly into the drop zone to upload the temperature logger data.
Note: Only .CSV and .TXT file formats from specific devices are currently supported for temperature logger uploads.
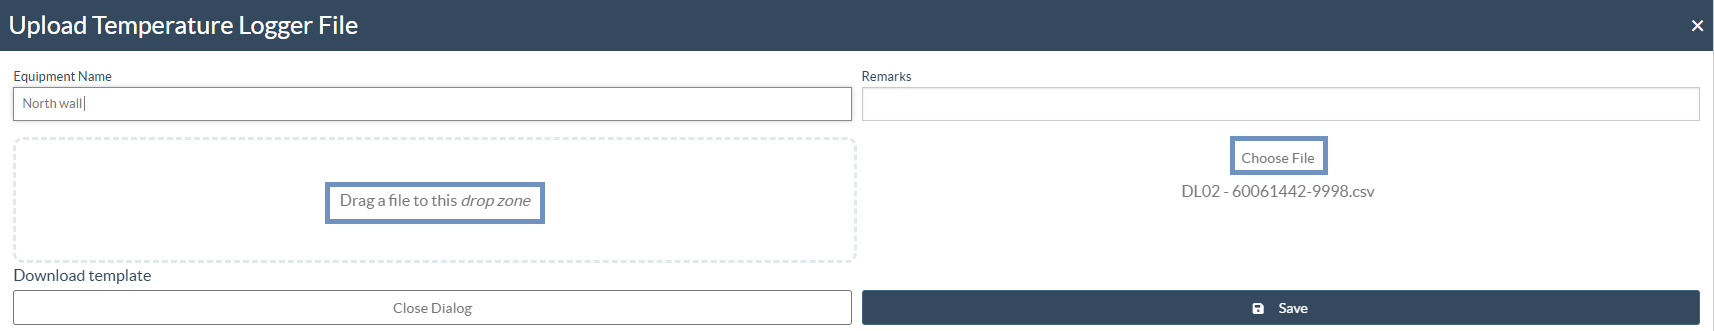
Step 3: Click “Save” to upload the file. Once saved, the logger data will be linked to the corresponding warehouse and stored for reference and reporting.
Step 4: Manage Data - To review previously uploaded files, click “Manage Data.” from the list. This screen displays details such as the Equipment Name, Date Range, and Uploaded By information. Authorized users can download or delete the uploaded record if required.
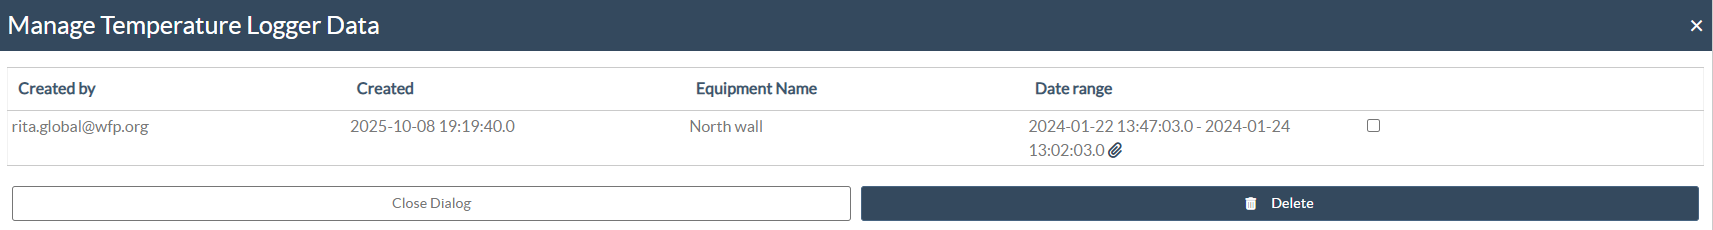
 | The Delete option is restricted to users with PRA (Project Administrator) rights due to the sensitivity of temperature monitoring information. |
Warehouse Charts
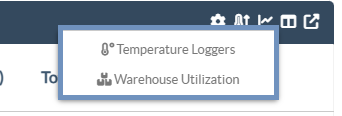
Under the Stock Management module, users have access to two analytical charts.
- Temperature Loggers
- Warehouse Utilization
Both charts can be accessed using the icon menu in the upper right corner of the Stock Management screen, allowing quick switching between Temperature Loggers and Warehouse Utilization views.
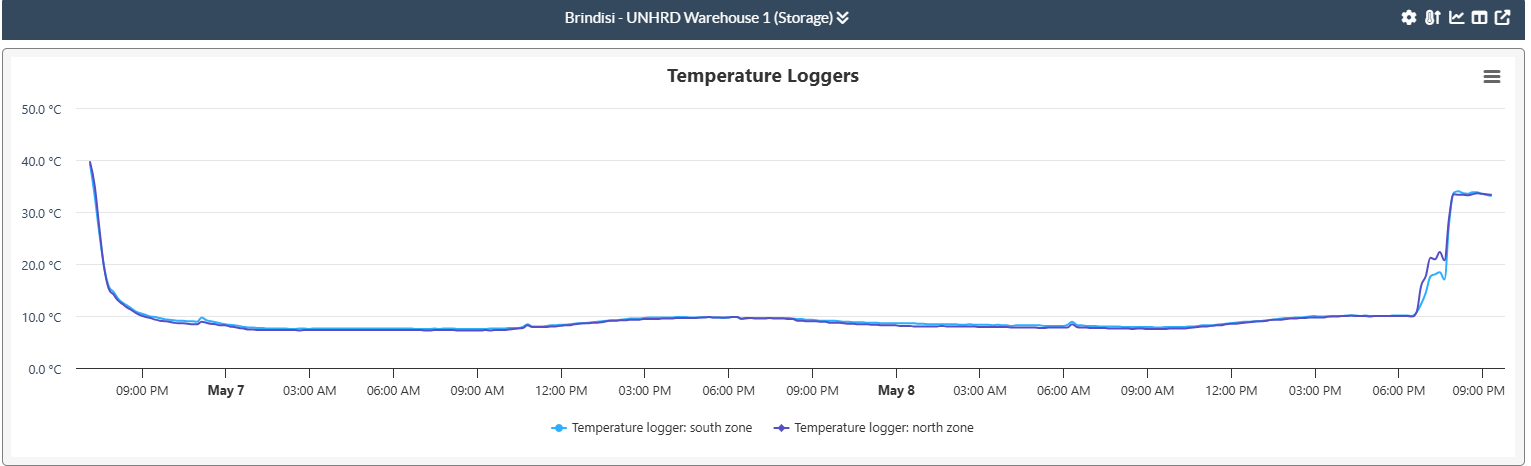
Temperature Loggers:
The Temperature Loggers chart displays the temperature readings recorded by data loggers installed within the warehouse. This allows operators to visually monitor temperature variations over a selected time period and ensure that sensitive commodities are maintained within the required storage range. Each line on the graph represents data from a specific logger, making it easier to track environmental consistency across different warehouse zones.
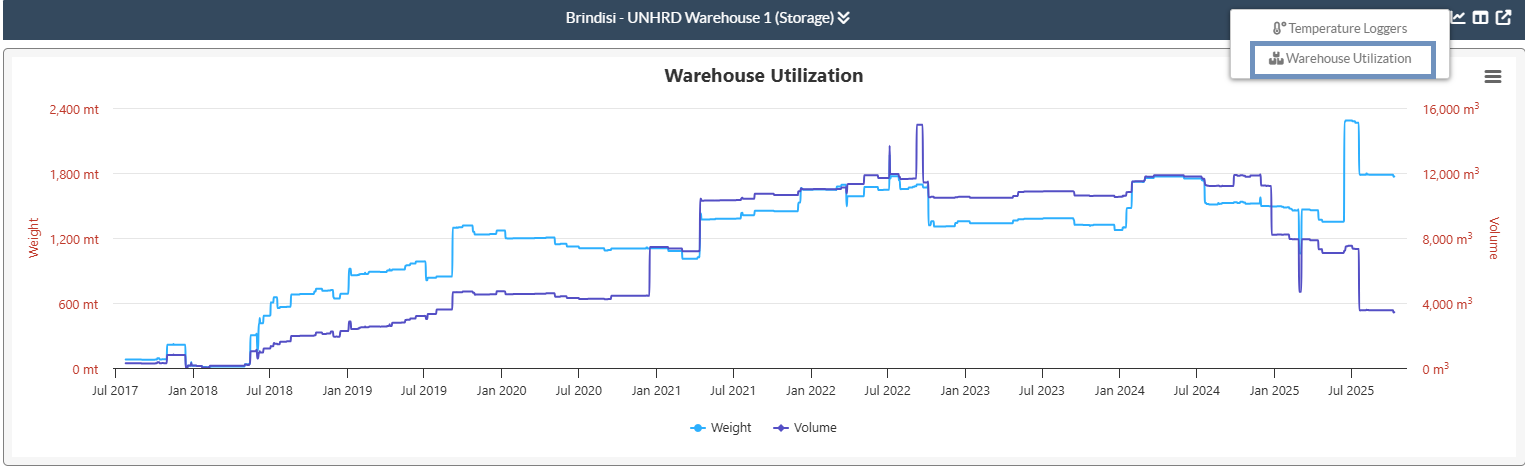
Warehouse Utilization:
The Warehouse Utilization chart presents a visual overview of storage occupancy trends based on Weight (mt) and Volume (m³). This helps operators assess how effectively warehouse space is being used over time, supporting planning and decision-making related to stock allocation, optimization, and throughput management.